Chuan Hao

ML titanic dataset

This was a beginner project/dataset I found on Kaggle to practice my skills in Data science and machine learning in python. The libraries used were, sciPy and sci-kit learn.

Introduction

I got interested in data science and machine learning after tinkering around with python for a bit. This was as I wanted to combine my interest in mathematics and programming into one. After looking around, I found that kaggle was a good place to start learning machine learning and data science.

Screenshot of the titanic dataset on kaggle
Figure 1: Screenshot of the titanic dataset on kaggle

Where it began

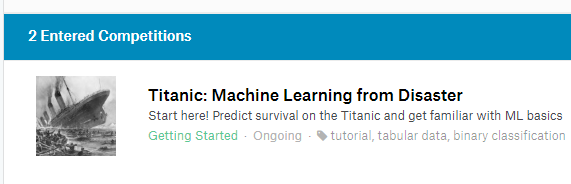
After finishing the basic tutorials for machine learning and data science on kaggle, I wanted to try my hands on an actual dataset and project. This was when I stumbled onto the Titanic dataset where it was not only suited for beginners but also had some tutorials made by other people. This gave me the idea to try the project on my own before I looked at other people's tutorial/solution. This way I was able to experience the project on my own, while still easy access to help if I get stuck. The goal of the dataset was to use some features that the passengers had, and use them to predict the survival rate of the passenger.

Process

This section will be a summary of the thought process I had while attempting this project. As I was still relatively new to the libraries, I had to check the documentation of specific methods multiple times. Also, I may not always use the most efficient way to perform some operations and thus I apologise for this.

Screenshot of data summarised in pandas
Figure 2: Screenshot of data summarised in pandas

Data Science/Analysis

I encountered a few problems while trying to analyse the dataset. This was as I still did not know how to properly visualise the correlation of particular features in the dataset. I also did not know what was the 'right' way to clean up missing data in datasets yet. However, in the end, I decided to use the median average as a way to fill gaps in my data. In addition, I picked out some features that I felt had a strong correlation with the survivability of the passenger.

Figure 3: Screenshot of the class code for the ML models

Machine Learning

I decided to use a class in python to somewhat automate the process of trying out different models from sci-kit learn. Such models include random tree classifiers, logistical regression and the K nearest neighbours. The class would split the training dataset into train, test and validate datasets. Using these datasets, I would try out different combination of models and hyperparameters to try and get the best results.

Conclusion

All in all, I learnt a lot about machine learning and data science from this project. With the knowledge I gained through this project I am actually attempting another dataset on kaggle, this time with much more data and features, so you can expect that project to be up here soon.

Figure 4: Screenshot of my position on the kaggle leaderboard

What I learnt

Through the whole project, I have learnt how to visualise data using the libraries seaborn and matplotlib to get a better understanding of trends in data. I have also learnt how to manipulate and work with data through the libraries numPy and pandas. Lastly, I have learnt how to generate, train and validate models in sci-kit learn modules.

Figure 5: Screenshot of the accuracy of my submissions into kaggle

Finished product

In the end, I managed to get a 79% accuracy on my predictions which was much better than my expectations. This project has made me have a much better appreciation for the intricacies in dealing with data and trying to predict the future using this data. I am now even more interested in this field of data science and artificial intelligence and would probably continue to try out more things in this field.